
Understanding market structure is one of the most fundamental steps in learning how to trade. Before indicators, strategies, or complex analysis, the market itself tells a story through the way price moves. Market structure is simply the language of that movement.
Every market moves through sequences of highs and lows—expansions and corrections, impulses and pauses. Within these movements, patterns begin to form: higher highs, higher lows, lower highs, and lower lows. These patterns are not random. They reveal the ongoing balance between buyers and sellers, and they provide the framework through which a trader can interpret what the market is doing.
Many traders search for certainty through indicators or signals, but market structure offers something more valuable: context. It allows the trader to understand whether the market is trending, consolidating, weakening, or strengthening. Instead of reacting to isolated signals, the trader begins to read the broader narrative unfolding on the chart.
However, market structure is often misunderstood as a rigid set of rules. In reality, it is better viewed as a framework for observation. Different traders may interpret the same chart in slightly different ways depending on timeframe, experience, and trading style. The goal is not to memorize patterns, but to develop the ability to see how price organizes itself over time.
In this section, we will explore the principles that define market structure and how they can help traders build a clearer understanding of price behavior. By learning to read structure, a trader moves closer to seeing the market not as a series of random movements, but as an evolving process shaped by participation, momentum, and changing expectations.
What Is Market Structure?
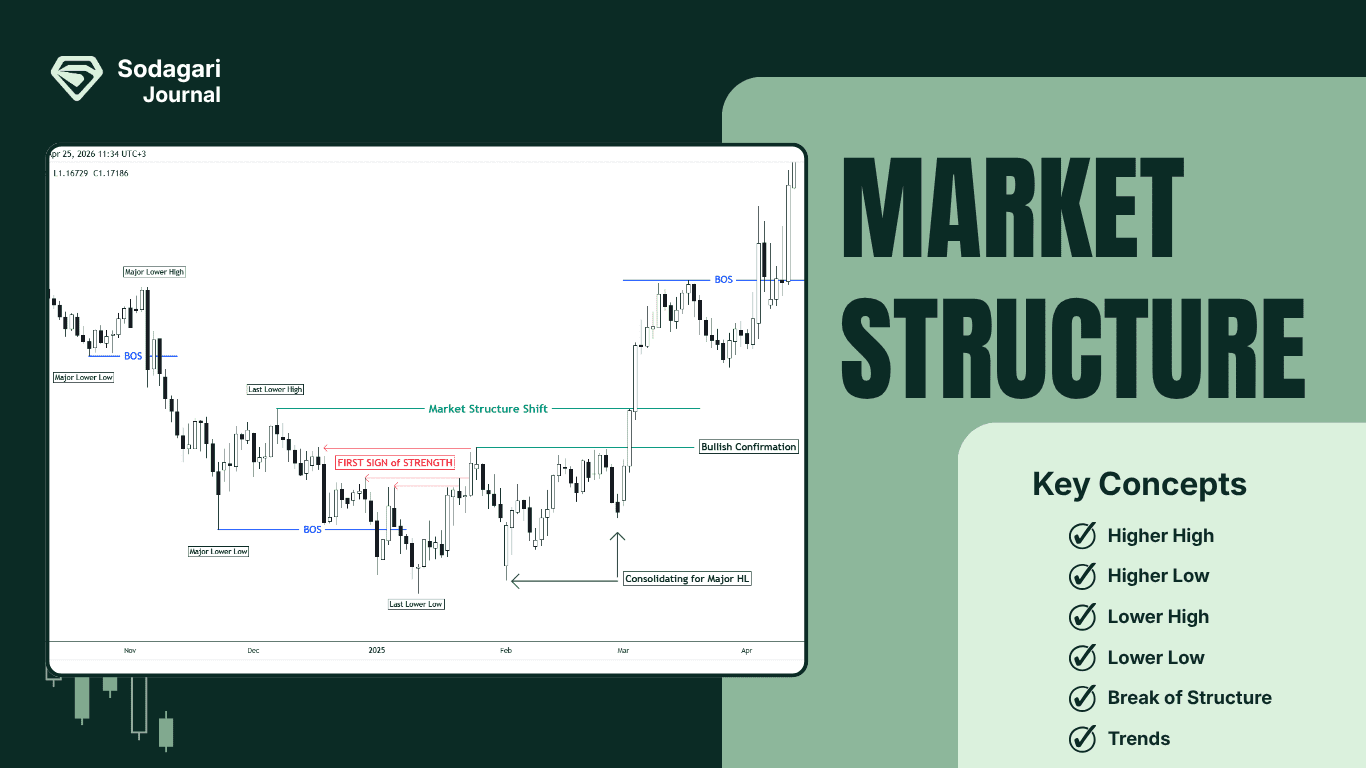
Market structure describes the way price organizes itself on a chart through the formation of highs and lows. As price moves, it creates swing highs and swing lows that form recognizable patterns over time.
These patterns help traders understand the general direction of the market. A sequence of higher highs and higher lows typically indicates bullish conditions, while lower highs and lower lows suggest bearish conditions. When these patterns are absent, the market may be moving within a range or consolidation.
By observing how these highs and lows develop, traders can gain insight into the underlying behavior of the market and the ongoing interaction between buyers and sellers.
Why Market Structure Matters?
Market structure matters because it provides context — and in trading, context is everything.
Price on its own is just movement. But when you understand structure, that movement becomes readable. You can begin to see whether the market is trending, losing momentum, or transitioning into a new phase. This shifts decision-making from reaction to interpretation.
Without market structure, traders often rely on isolated signals: a candle pattern, an indicator cross, or a sudden spike. The problem is that these signals mean very little without knowing where they occur within the broader structure of the market. The same signal can represent continuation in one context and reversal in another.
Market structure helps solve this ambiguity. It allows traders to position price within a larger narrative — understanding whether they are trading with the dominant direction or against it.
It also plays a critical role in timing. Recognizing structural shifts, such as breaks or failures to continue a trend, can highlight moments where the balance between buyers and sellers is changing. These are often the areas where opportunities emerge.
In short, market structure does not predict the market. It organizes it. And that organization is what allows traders to make decisions with clarity instead of assumption.
Why Market Structure Matters?
Market structure is built from a few simple but essential price elements. Everything you see on a chart — trends, reversals, consolidations — is ultimately constructed from these basic components.
The first and most important building blocks are swing highs and swing lows. These are the turning points in price where momentum pauses and direction temporarily shifts. Swing points form the skeleton of structure, defining how the market moves from one phase to another.
Between these swings, price moves in two main ways: impulses and corrections. An impulse is a strong directional move that reflects dominance from buyers or sellers. A correction is a temporary pause or pullback against that move, often reflecting balance or profit-taking.
When these elements connect over time, they begin to form a readable structure. The sequence of swings and the relationship between impulses and corrections is what allows traders to identify trends, transitions, and potential reversals.
Understanding these building blocks is essential because everything else in market structure — trend identification, structural breaks, or market phases — is built on top of them.
Bullish vs Bearish Market Structure
Market structure can generally be understood through two primary directional conditions: bullish structure and bearish structure. These conditions are defined by the sequence in which highs and lows form on the chart.
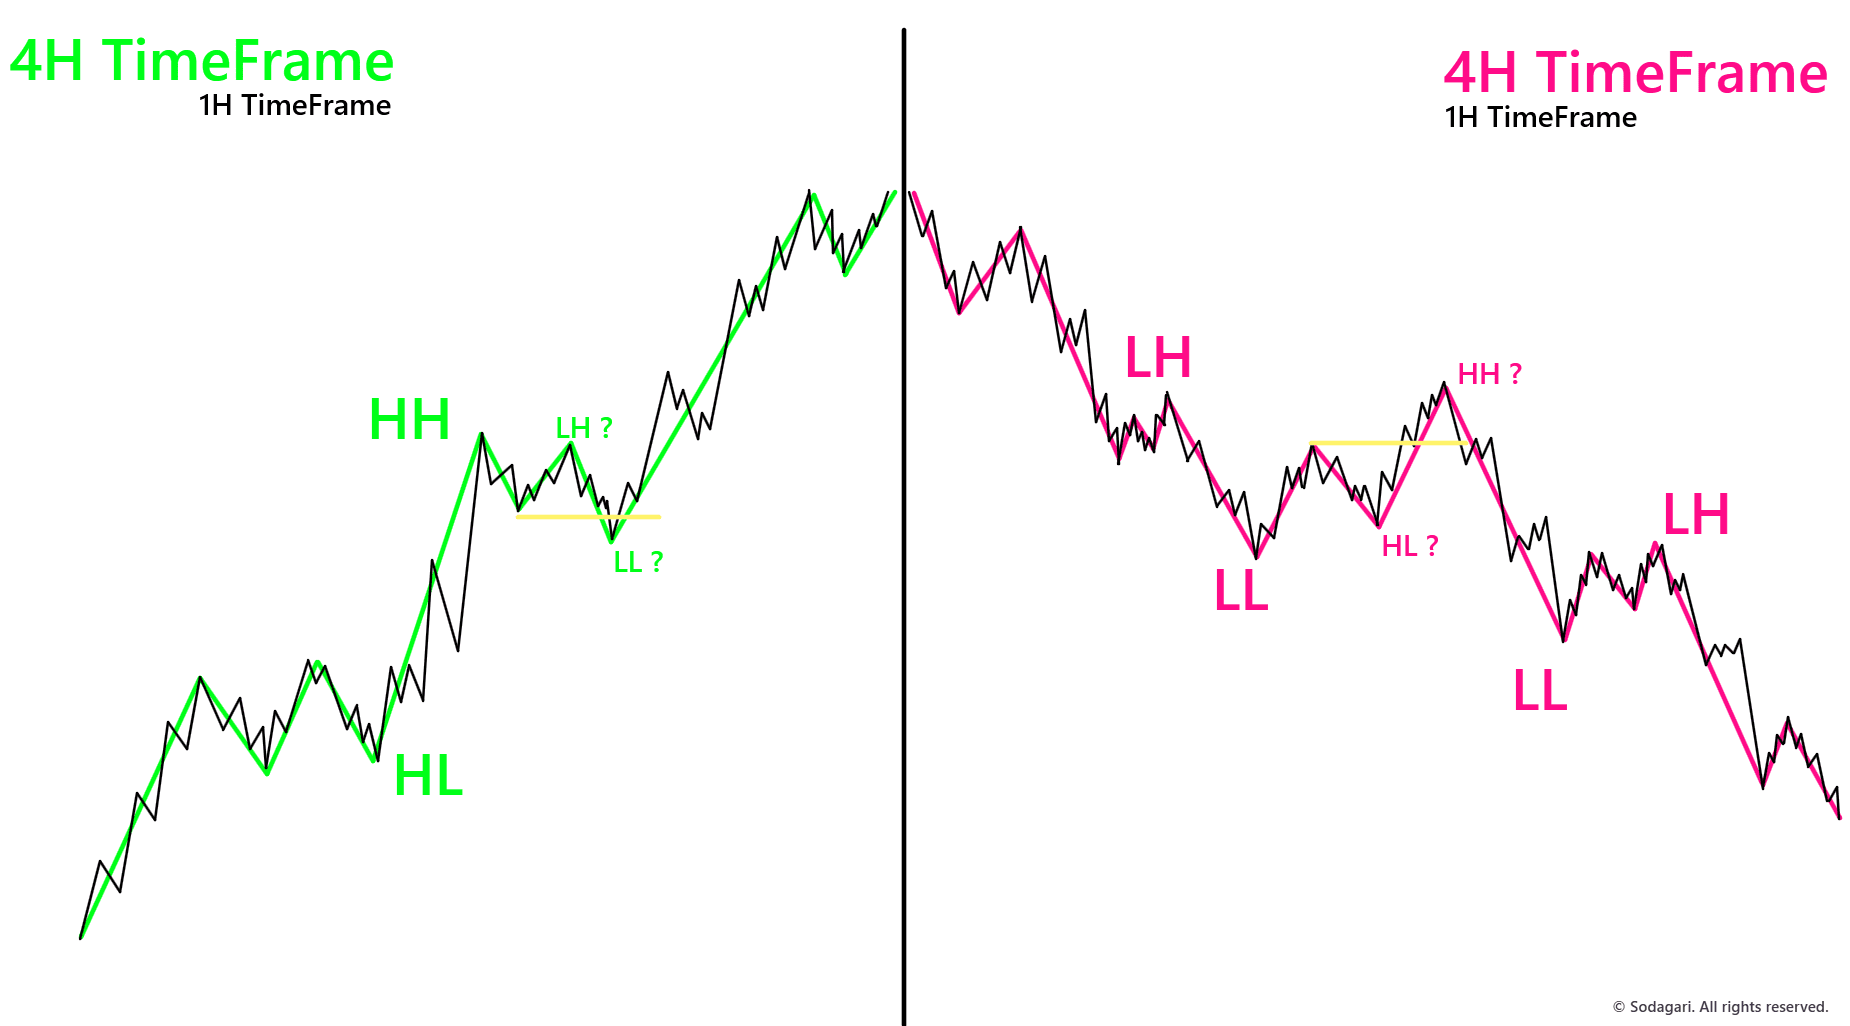
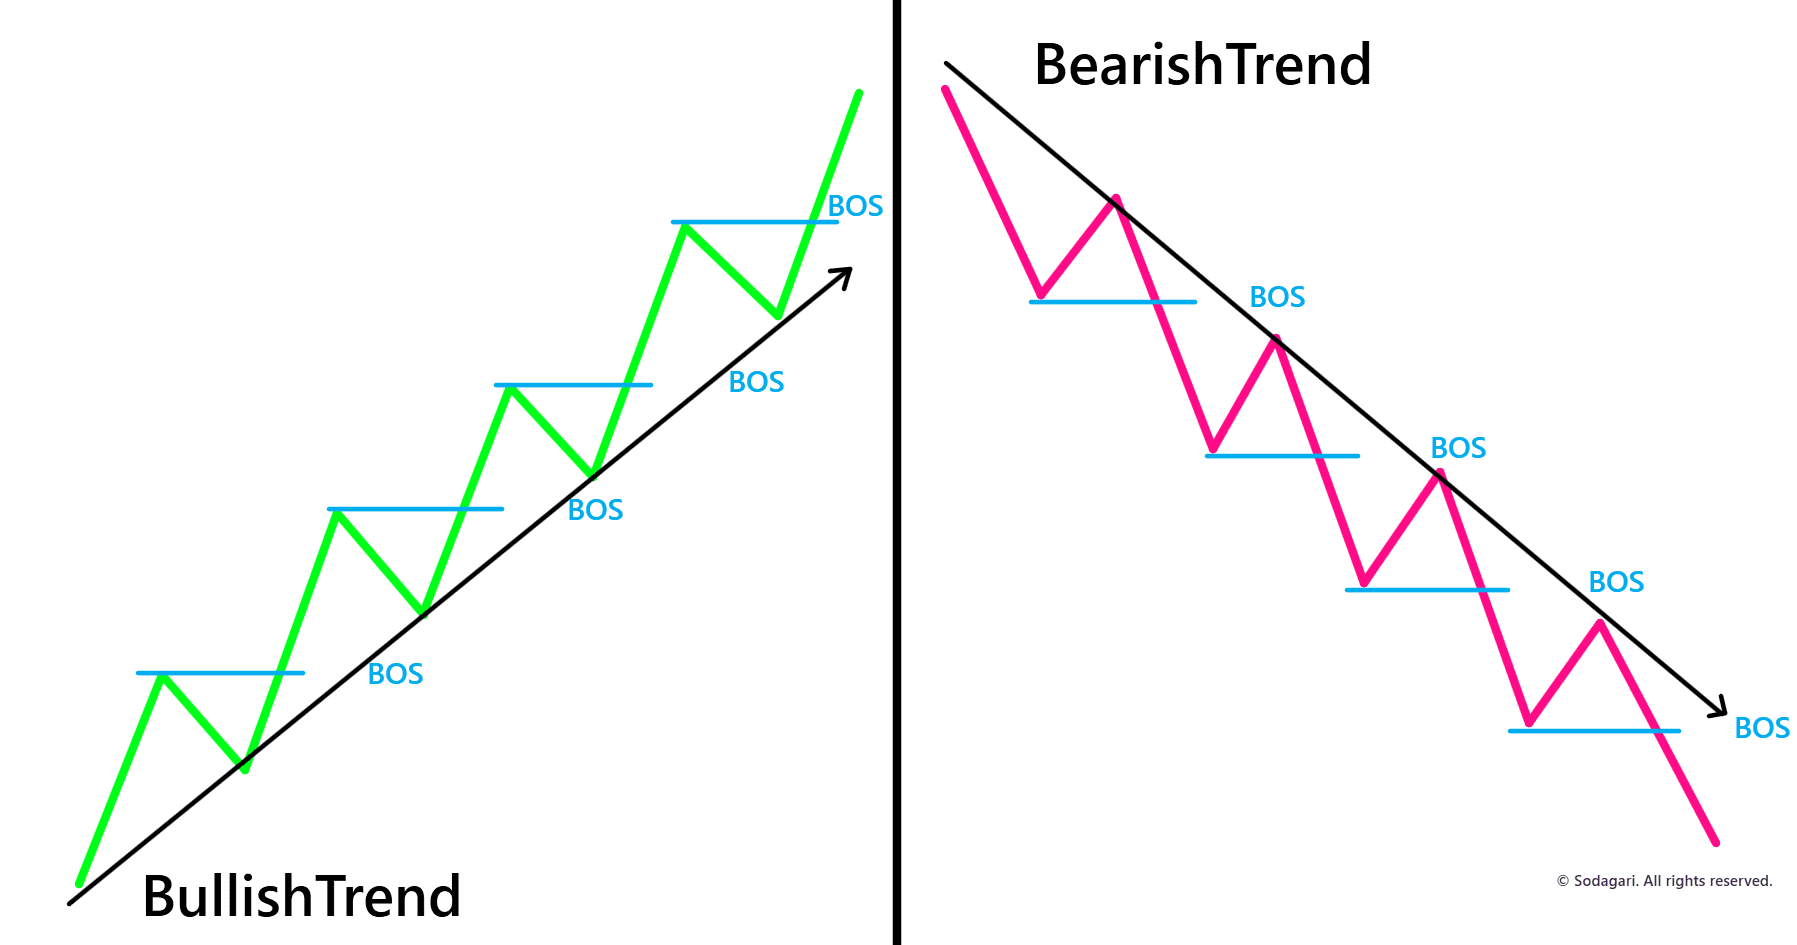
A bullish market structure develops when price consistently forms higher highs (HH) and higher lows (HL). This pattern indicates that buyers are gradually gaining control of the market. Each new upward move pushes price beyond the previous high, while pullbacks tend to hold above the previous low. As long as this sequence remains intact, the broader structure of the market can be considered bullish.
In contrast, a bearish market structure forms when price produces lower highs (LH) and lower lows (LL). In this case, sellers dominate the market. Downward movements continue to break previous lows, while rallies struggle to move above prior highs. This sequence reflects sustained selling pressure and a market that is generally moving downward.
Recognizing these structural patterns helps traders determine the dominant direction of the market. Instead of focusing only on individual price movements, they can observe whether the overall sequence of highs and lows supports bullish continuation or bearish continuation.
However, market structure is dynamic. A bullish structure can weaken if price fails to create a new higher high, and a bearish structure can begin to shift if lower highs stop forming. For this reason, traders must continually observe how these sequences evolve rather than assuming that a trend will persist indefinitely.
Major and Minor Market Structure
Not all movements within the market carry the same importance. Some swings define the broader direction of the market, while others represent smaller fluctuations within that larger movement. This distinction is often described as major structure and minor structure.
Major market structure refers to the primary framework of the market — the sequence of significant highs and lows that define the dominant trend. These structural points usually form over larger movements and help traders understand the broader directional bias of the market.
Within this larger framework, price often forms smaller internal movements. These are referred to as minor structure. Minor swings appear as smaller highs and lows that develop during pullbacks, consolidations, or short-term fluctuations inside the major trend.
For example, in a bullish market where price is forming higher highs and higher lows, the overall structure remains bullish even though smaller bearish movements may appear in the short term. These temporary pullbacks create minor lower highs and lower lows, but they do not necessarily change the major structure unless they break a significant structural level.
Distinguishing between major and minor structure helps traders avoid misinterpreting normal market fluctuations as meaningful trend changes. By focusing on the most relevant structural points, traders can better understand whether the market is truly shifting direction or simply correcting within an existing trend.
Structural Breaks in the Market
Market structure does not remain static. As price evolves, there are moments when the existing pattern of highs and lows is disrupted. These moments are known as structural breaks.
A structural break occurs when price moves beyond a level that previously defined the current structure. In other words, the sequence that was maintaining the trend is interrupted. This disruption often signals that the balance between buyers and sellers may be changing.
For example, in a bullish structure the market typically forms higher highs and higher lows. If price falls and breaks below a significant higher low, the bullish sequence is no longer intact. Similarly, in a bearish structure, a break above a meaningful lower high may indicate that the downward momentum is weakening.
Structural breaks are important because they highlight potential transitions in market conditions. They may signal the continuation of an existing trend, a deeper correction, or in some cases the early stages of a reversal.
However, not every break leads to a lasting change in direction. Markets frequently produce temporary breaks before returning to the previous structure. For this reason, structural breaks should be interpreted within the broader context of market behavior rather than treated as automatic signals.
In the following sections, we will explore two commonly discussed forms of structural breaks — Break of Structure (BOS) and Change of Character (CHOCH) — and how traders use them to interpret shifts in market dynamics.
Break of Structure
A Break of Structure (BOS) occurs when price moves beyond a previous structural level in the direction of the current trend. It represents the market’s ability to continue its existing momentum by surpassing a prior high or low.
In a bullish structure, a break of structure typically happens when price rises above a previous swing high, creating a new higher high. This confirms that buyers are still in control and that the upward movement of the market is continuing.
In a bearish structure, a break of structure occurs when price falls below a previous swing low, producing a new lower low. This indicates that sellers remain dominant and that the downward trend is still intact.
The key idea behind a break of structure is continuation. Rather than signaling a reversal, a BOS usually confirms that the market is maintaining its current directional structure.
However, identifying a valid break of structure requires attention to context. Not every small movement beyond a previous high or low should be considered meaningful. Traders often focus on breaks that occur at significant swing points, as these levels better represent the underlying structure of the market.
By observing where and how these structural breaks occur, traders can better understand whether the market is reinforcing the current trend or beginning to lose momentum.
Change of Character (CHOCH)
A Change of Character (CHOCH) refers to a shift in the behavior of market structure. It occurs when price breaks a structural level that previously defined the current trend, suggesting that the market may be transitioning into a different phase.
In a bullish trend, the market normally forms higher highs and higher lows. If price suddenly breaks below a significant higher low, this may represent a change in character. The sequence that maintained the bullish structure is interrupted, indicating that buying momentum may be weakening.
In a bearish trend, the opposite situation may occur. When price breaks above a meaningful lower high, it may signal that the persistent selling pressure is starting to fade and that the market could be transitioning away from the bearish structure.
Unlike a break of structure, which typically confirms trend continuation, a change of character often represents the first warning that the existing structural pattern may be shifting. It does not guarantee a reversal, but it highlights a potential transition in market behavior.
For this reason, traders often view CHOCH as an early signal that the balance between buyers and sellers is beginning to change. Further structural developments are usually required before a new trend can be considered established.
Market Structure Across Timeframes
Market structure is not limited to a single timeframe. The same principles that define structure on a small chart also apply to larger ones. Highs and lows, impulses and corrections, and structural breaks can be observed on almost any timeframe — from minutes to months.
However, the structure seen on one timeframe is often part of a larger structure on another. A move that appears as a clear trend on a lower timeframe may simply represent a correction within a broader trend on a higher timeframe.
For example, a market may show a short-term bearish sequence of lower highs and lower lows on a lower timeframe, while the higher timeframe still maintains a bullish structure. In this case, the smaller bearish movement may only be a pullback within a larger upward trend.
Understanding this relationship between timeframes helps traders place price movements into proper context. Instead of analyzing structure in isolation, they can evaluate how lower timeframe movements fit within the broader structure of the market.
For this reason, many traders observe structure on multiple timeframes. The higher timeframe often provides the broader directional framework, while the lower timeframe can reveal the internal movements that occur within that larger structure.
Common Mistakes Traders Make When Reading Structure
Even though market structure looks simple on the surface, it is one of the most commonly misinterpreted concepts in trading. Many mistakes come not from the idea itself, but from how traders apply it in real time.
One of the most frequent mistakes is forcing structure where it is not clear. Traders often try to label every small movement as a higher high, lower low, or structural break, even when price is actually just consolidating. This leads to confusion and false confidence in analysis.
Another common issue is ignoring context. A break of structure on a lower timeframe is often treated as a meaningful reversal, even when the higher timeframe structure remains intact. Without context, traders end up reacting to noise instead of real structural change.
Many traders also struggle with premature conclusions. They see an early break or a single strong candle and immediately assume a trend reversal or continuation, without waiting for the structure to confirm the move.
A further mistake is treating structure as rigid rules instead of a dynamic process. Market structure is not a checklist; it evolves. What looks like a valid structure in one phase of the market may lose relevance as conditions change.
Finally, some traders focus only on identifying structure but fail to connect it with market behavior and momentum. Structure alone is not enough — it needs to be interpreted alongside how price is actually reacting at key levels.
Avoiding these mistakes is less about adding complexity and more about developing patience and clarity. The goal is not to label every move, but to understand what the market is truly doing.
Related Concepts in Market Structure
Market structure is the foundation, but it does not work in isolation. To fully understand price behavior, it needs to be connected with a few closely related concepts that give it depth and precision.
One of the most important is liquidity. Market structure shows direction through highs and lows, but liquidity explains why price often moves toward certain levels. Equal highs, equal lows, and obvious swing points tend to act as liquidity pools where price is naturally drawn before continuing or reversing.
Another key concept is support and resistance. While structure defines the sequence of market highs and lows, support and resistance highlight areas where price has previously reacted. These zones often align with structural points, reinforcing their importance.
Trend context is also closely tied to structure. A trend is essentially the outcome of a sustained structural sequence. Understanding whether the market is in expansion, correction, or transition helps interpret structural signals more accurately.
In addition, order flow and momentum provide insight into the strength behind structural moves. Two markets can show the same structural break, but the one with stronger momentum behind it is more likely to follow through.
Finally, concepts like liquidity sweeps and false breaks help explain situations where structure appears to change but quickly returns to its previous state. These moments are especially important in understanding market manipulation and short-term inefficiencies.
Together, these concepts expand market structure from a simple pattern-reading tool into a more complete framework for understanding how and why price behaves the way it does.
Market Structure as a Framework, Not a Rule
Market structure is often misunderstood as a strict system with fixed outcomes. In reality, it is not a rule-based mechanism that predicts the market with certainty. It is a framework for interpretation.
The purpose of market structure is not to tell you exactly what will happen next, but to help you understand what is currently happening. It organizes price action into a readable form so that traders can make sense of movement, context, and behavior.
This distinction is important. Markets are dynamic, and they rarely follow perfect patterns. A structure that appears clear in hindsight can often feel uncertain in real time. This is why relying on structure as a rigid rule can lead to frustration and misinterpretation.
Instead, market structure should be used as a way to frame probability, not guarantee outcomes. It helps identify when the market is trending, when it is transitioning, and when it is uncertain. But it does not remove uncertainty itself.
Over time, traders who develop a deeper understanding of structure stop trying to predict every move. They begin to observe how price behaves within its own logic and adjust their decisions accordingly.
In that sense, market structure is less about control and more about awareness. It provides clarity in an environment that is inherently uncertain — and that clarity is where its real value lies.